|
|
|
 |
| Morningstar
Quicktake Report |
|
 |
 |
| Photronics
PLAB |
|
 |
| Historical
Overview |
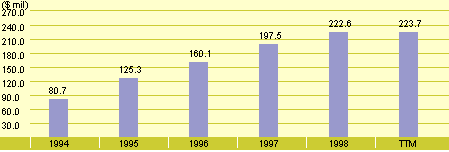
| Annual Sales |
 |
 |
| Fiscal year-end:
October |
TTM = Trailing
12 Months |
 |
 |
| Growth |
|
1994 |
|
1995 |
|
1996 |
|
1997 |
|
1998 |
|
TTM |
| Sales % |
|
|
|
55.3 |
|
27.8 |
|
23.4 |
|
12.7 |
|
|
| Earnings/Share % |
|
|
|
62.7 |
|
4.8 |
|
18.4 |
|
-18.4 |
|
|
| Book Value/Share % |
|
|
|
50.5 |
|
8.5 |
|
15.3 |
|
10.0 |
|
|
 |
 |
| Profits |
| Net Income $Mil |
|
10 |
|
19 |
|
21 |
|
26 |
|
20 |
|
11 |
|
| Earnings/Share $ |
|
0.51 |
|
0.83 |
|
0.87 |
|
1.03 |
|
0.84 |
|
0.45 |
|
| EPS (Cont Ops) $ |
|
0.51 |
|
0.83 |
|
0.87 |
|
1.03 |
|
0.84 |
|
0.45 |
|
| Dividends/Share $ |
|
0.00 |
|
0.00 |
|
0.00 |
|
0.00 |
|
0.00 |
|
0.00 |
|
| Total Shares Mil |
|
20 |
|
21 |
|
24 |
|
24 |
|
24 |
|
24 |
|
 |
 |
| Returns
on Capital |
| Net Margin % |
|
12.8 |
|
14.9 |
|
13.1 |
|
13.0 |
|
9.2 |
|
4.8 |
|
| Asset Turnover |
|
0.8 |
|
0.7 |
|
0.8 |
|
0.5 |
|
0.6 |
|
0.6 |
|
| Financial Leverage |
|
1.2 |
|
1.3 |
|
1.4 |
|
2.0 |
|
1.9 |
|
1.9 |
|
| Return on Equity % |
|
12.9 |
|
13.9 |
|
13.4 |
|
13.8 |
|
10.2 |
|
5.2 |
|
| Industry
Rank |
|
25 |
|
47 |
|
47 |
|
38 |
|
42 |
|
57 |
|
| Return on Assets % |
|
10.5 |
|
10.7 |
|
9.9 |
|
7.0 |
|
5.5 |
|
2.8 |
|
| Industry
Rank |
|
15 |
|
37 |
|
38 |
|
47 |
|
46 |
|
58 |
|
| Industry
Rank (100=Worst) |
|
 |
 |
| Cash
Flow $Mil |
|
| Operating Cash Flow |
|
|
|
|
|
39 |
|
47 |
|
45 |
|
|
|
| – Capital Spending |
|
|
|
|
|
56 |
|
96 |
|
66 |
|
|
|
| = Free Cash Flow |
|
|
|
|
|
-17 |
|
-50 |
|
-21 |
|
|
|
| Data through month-end. |
 |
| Balance-Sheet
Breakdown |
| 07/31/99 |
 |
 |
 |
| |
|
| |
Assets |
|
$Mil |
|
% |
|
Cash |
|
7.6 |
|
2.0 |
|
Other Current Assets |
|
59.9 |
|
15.5 |
|
Long-term Assets |
|
319.6 |
|
82.6 |
| |
Total |
|
387.1 |
|
100.0 |
|
 |
 |
 |
| |
|
| |
Liabilities
and Equity |
|
$Mil |
|
% |
|
Current Liabilities |
|
50.2 |
|
13.0 |
|
Long-Term Liabilites |
|
132.7 |
|
34.3 |
|
Shareholders' Equity |
|
204.1 |
|
52.7 |
| |
Total |
|
387.1 |
|
100.0 |
|
|